Mathematical and experimental investigation of heat control and power increase in air-cooled aircraft engines
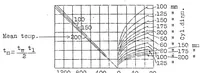
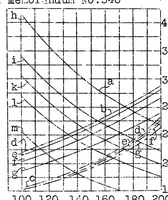
A 1929 NASA technical report on heat control and power increase in air-cooled aircraft engines, prepared for aeronautical engineers and researchers. Its pictures are plain engineering nomogram-style charts: grid-ruled graphs with labelled curves, scale lines and mean-temperature axes, showing how cylinder diameter and temperature relate. A designer could take the stark, data-driven graphic vocabulary of dense gridlines, diagonal reference lines and fan-shaped curve families as a source of technical chart styling.