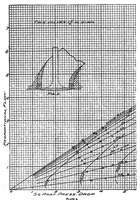
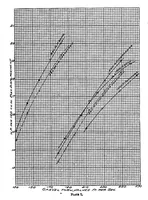
Air flow through poppet valves
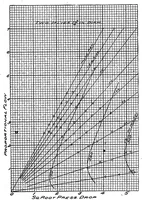
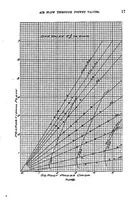
This is a 1920 technical report from NASA's Technical Reports Server, a set of graphs of air flow through poppet valves, plotting proportional flow against square root of pressure drop for valves of different diameters. The plates are engineering charts drawn on squared grid paper, with a cross-section diagram of a valve on one plate. A designer could take from them the dense, precise look of line-and-grid data plots, with fanning straight lines, labelled axes and small plotted marks.