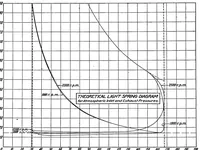
Calculation of low-pressure indicator diagrams
A 1920 technical report from the NASA Technical Reports Server, apparently issued for engineers studying engine indicator diagrams at low pressure. The plate is a single graph of pressure against volume, with curves labelled by engine speed in revolutions per minute and a boxed caption for theoretical light spring diagrams under atmospheric inlet and exhaust pressures. A designer might take from it the clean, gridded line-chart look: thin black curves on a fine grid with dashed reference lines and small callouts.