Factors of airplane engine performance
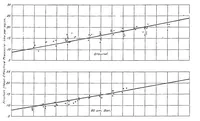
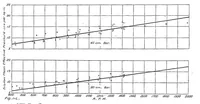
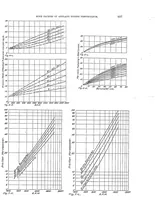
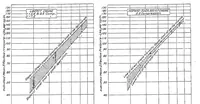
A 1921 technical report from the NASA Technical Reports Server, a government aeronautical research series, presenting test data on airplane engine performance for engineers. The pictures are plain line graphs with scattered data points, fitted straight trend lines, and ruled grids, plotting mean effective pressure against engine speed in revolutions per minute and friction horsepower. A designer might take from them the restrained, utilitarian look of early engineering charts: pale grid paper, hand-plotted points, and labelled axes in small serif type.