The Pressure Distribution over the Horizontal Tail Surfaces of an Airplane II
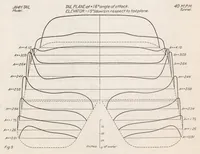
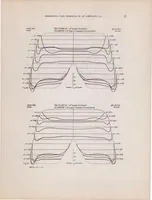
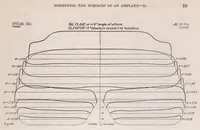
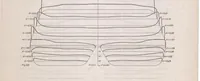
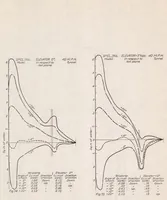
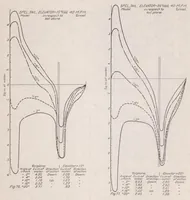
A 1921 NASA technical report, published by the National Advisory Committee for Aeronautics, presenting wind tunnel measurements of pressure distribution over airplane horizontal tail surfaces at 40 miles per hour for engineers and aircraft designers. The pages are dense plotted charts of pressure curves across tail-plane models at several angles of attack and elevator settings, drawn as closed outlines with dashed reference lines and labelled scales in inches of water. A designer might take from them only the abstract rhythm of nested curves and symmetric fan-shaped outlines, since the charts carry no pictorial content.