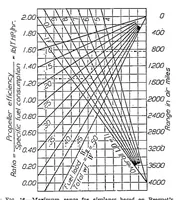
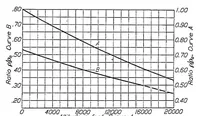
Charts for graphical estimation of airplane performance
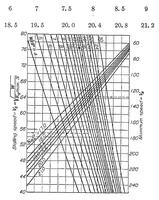
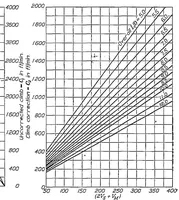
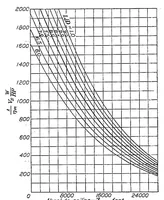
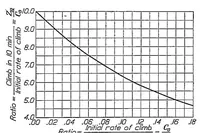
A 1925 set of engineering charts from the NASA Technical Reports Server, presenting graphical methods for estimating airplane performance such as climb, speed and power. The pages are plain line graphs with dense gridlines, labelled axes, families of curves and printed scale values, intended for engineers and pilots working out aircraft figures by reading values off the plots. For a designer, the pictures offer a sober model of technical data layout: stacked graph panels, curve families fanning across a grid, and labelled axes with fine tick marks.