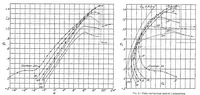
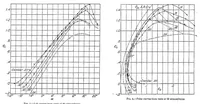
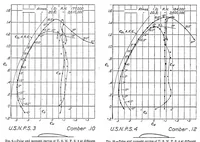
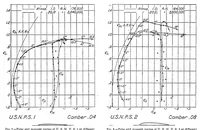
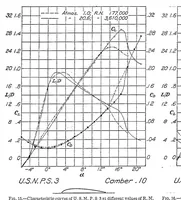
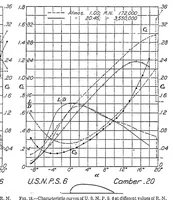
Characteristics of propeller sections tested in the variable density wind tunnel
A 1928 NASA technical report on propeller airfoil sections tested in the variable density wind tunnel, written for aeronautical engineers and aerodynamics researchers. The pictures are plotted engineering charts of lift and drag coefficients against angle of attack, with polar curves drawn as closed loops labelled by camber, mostly in black line on white paper. A designer could take the clean, sparse graph layouts and their labelled axis conventions as a model for technical data figures.