Airfoil Pressure Distribution Investigation in the Variable Density Wind Tunnel
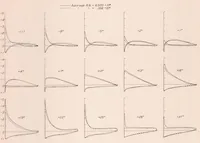
A 1931 NASA technical report on airfoil pressure distribution tests in the Variable Density Wind Tunnel, presented as a set of engineering data plots for aeronautical researchers. The single picture is a grid of fifteen small line graphs, each labelled with an angle of attack in degrees and sharing a legend for average Reynolds number, with solid and dashed curves tracing pressure against chord position. A designer might take from it the clean, repeated modular layout and the restrained grey-and-line vocabulary of mid-century scientific charts.