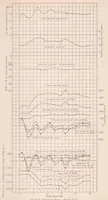
Pressure Distribution Over the Fuselage of a PW-9 Pursuit Airplane in Flight
This NASA technical report from 1932 presents flight test measurements of pressure distribution over the fuselage of a PW-9 pursuit airplane, prepared for aeronautical engineers and researchers. The single picture is a dense stack of time-history line graphs plotting normal acceleration, rudder velocity, normal center of pressure, and normal and transverse loads against time in seconds, drawn on a grid with fine black lines on white paper. A designer could take from it the value of plain grid-based chart layouts with stacked labelled traces and small tick annotations.