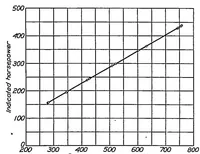
The effect of humidity on engine power at altitude
A 1933 technical report from the NASA Technical Reports Server, a series of engineering papers on aircraft engine performance and test data, aimed at engineers and researchers studying how air conditions affect power output. The single picture is a plotted scatter graph on a ruled grid, with a straight best-fit line rising from lower left to upper right, showing indicated horsepower against an unlabelled horizontal quantity. A designer might take from it a clean, minimal chart style: thin black axes, small open circle data points, and a bold diagonal trend line on a light grid.