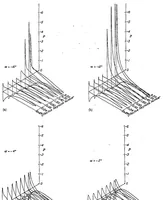
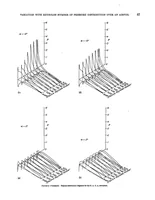
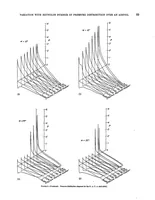
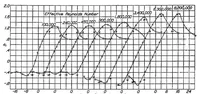
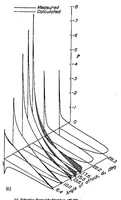
The variation with Reynolds number of pressure distribution over an airfoil section
A 1938 NASA technical report, issued through the NASA Technical Reports Server, presenting measured pressure distributions over an airfoil section at varying Reynolds numbers and angles of attack for aeronautical engineers. The pictures are three-dimensional stacked line plots where each curve traces pressure coefficient against chordwise position, with pressure rising sharply as the angle of attack increases. A designer might borrow their dense receding ridgelines and sharp vertical spikes as a rhythmic, topographic graphic motif.