Graphic methods for presenting facts
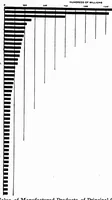
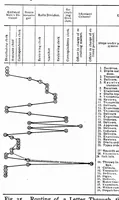
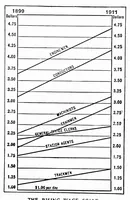
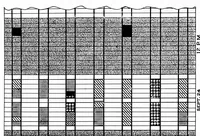
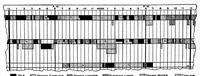
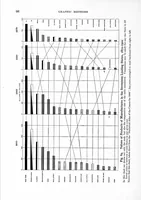
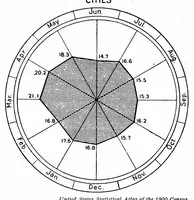
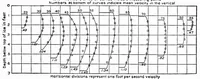
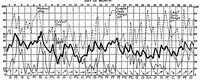
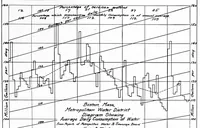
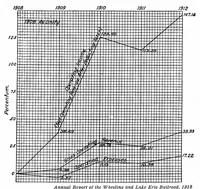
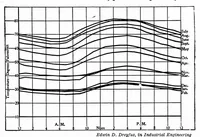
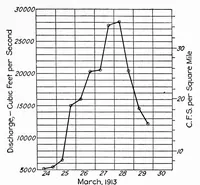
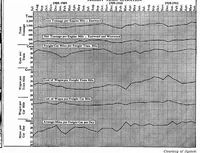
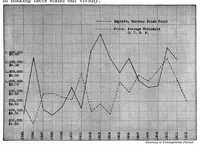
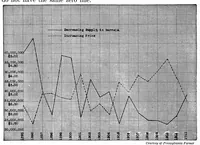
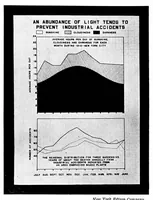
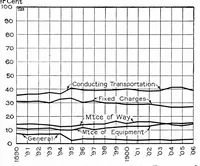
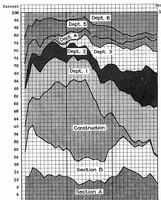
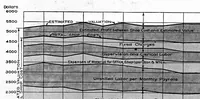
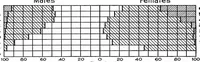
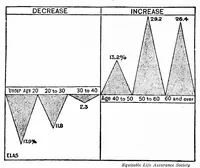
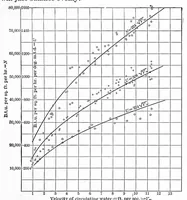
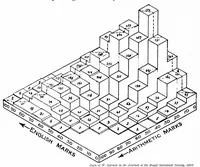
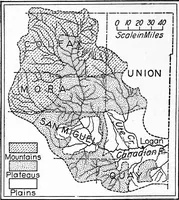
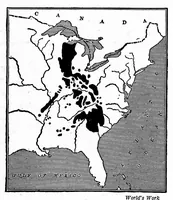
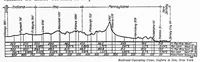
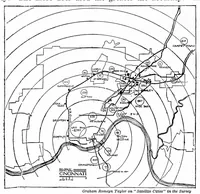
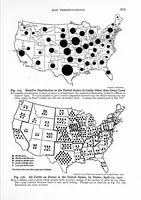
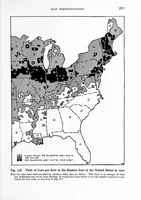
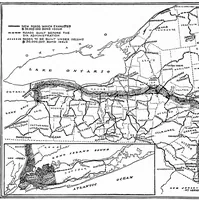
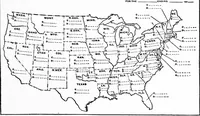
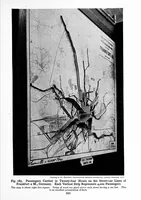
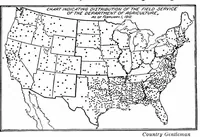
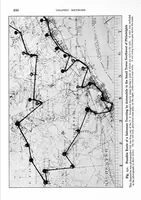
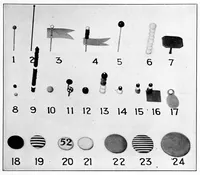
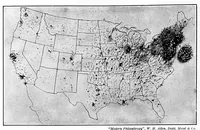
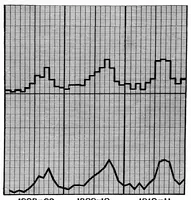
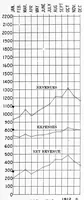
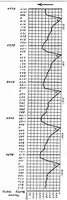
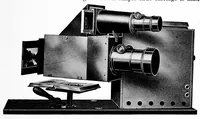
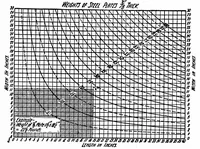
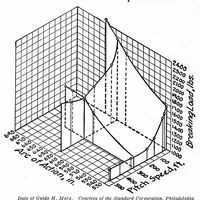
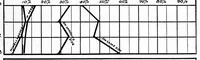
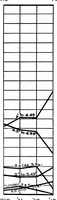
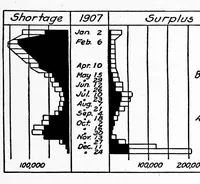
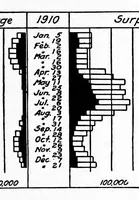
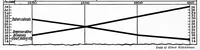
A 1914 American engineering handbook by Willard Cope Brinton, published in New York by the Engineering Magazine Company, teaching business and engineering readers how to present statistical facts through charts and graphs. The pictures are plain black-and-white line charts: a tuberculosis and heart-disease trend chart with dated axes, dense percentage-scaled bar and line diagrams, a vertical time-series trace with a left-pointing arrow, and a tall stepped chart with angled lines and labelled ranges, useful to a designer for clear, unadorned data graphics.